
The PRIMED Consortium brings together over 75 new and existing studies and consortia with a broad range of phenotypes, molecular data types, and ancestral diversity.
Additionally, the OurHealth study was selected for the PRIMED Supplemental Genotyping Program to undergo Blended-Genome Exome sequencing of over 1,000 study participants. This data is made available to the scientific community via the AnVIL platform, as described in Accessing OurHealth data.
Table of Contents
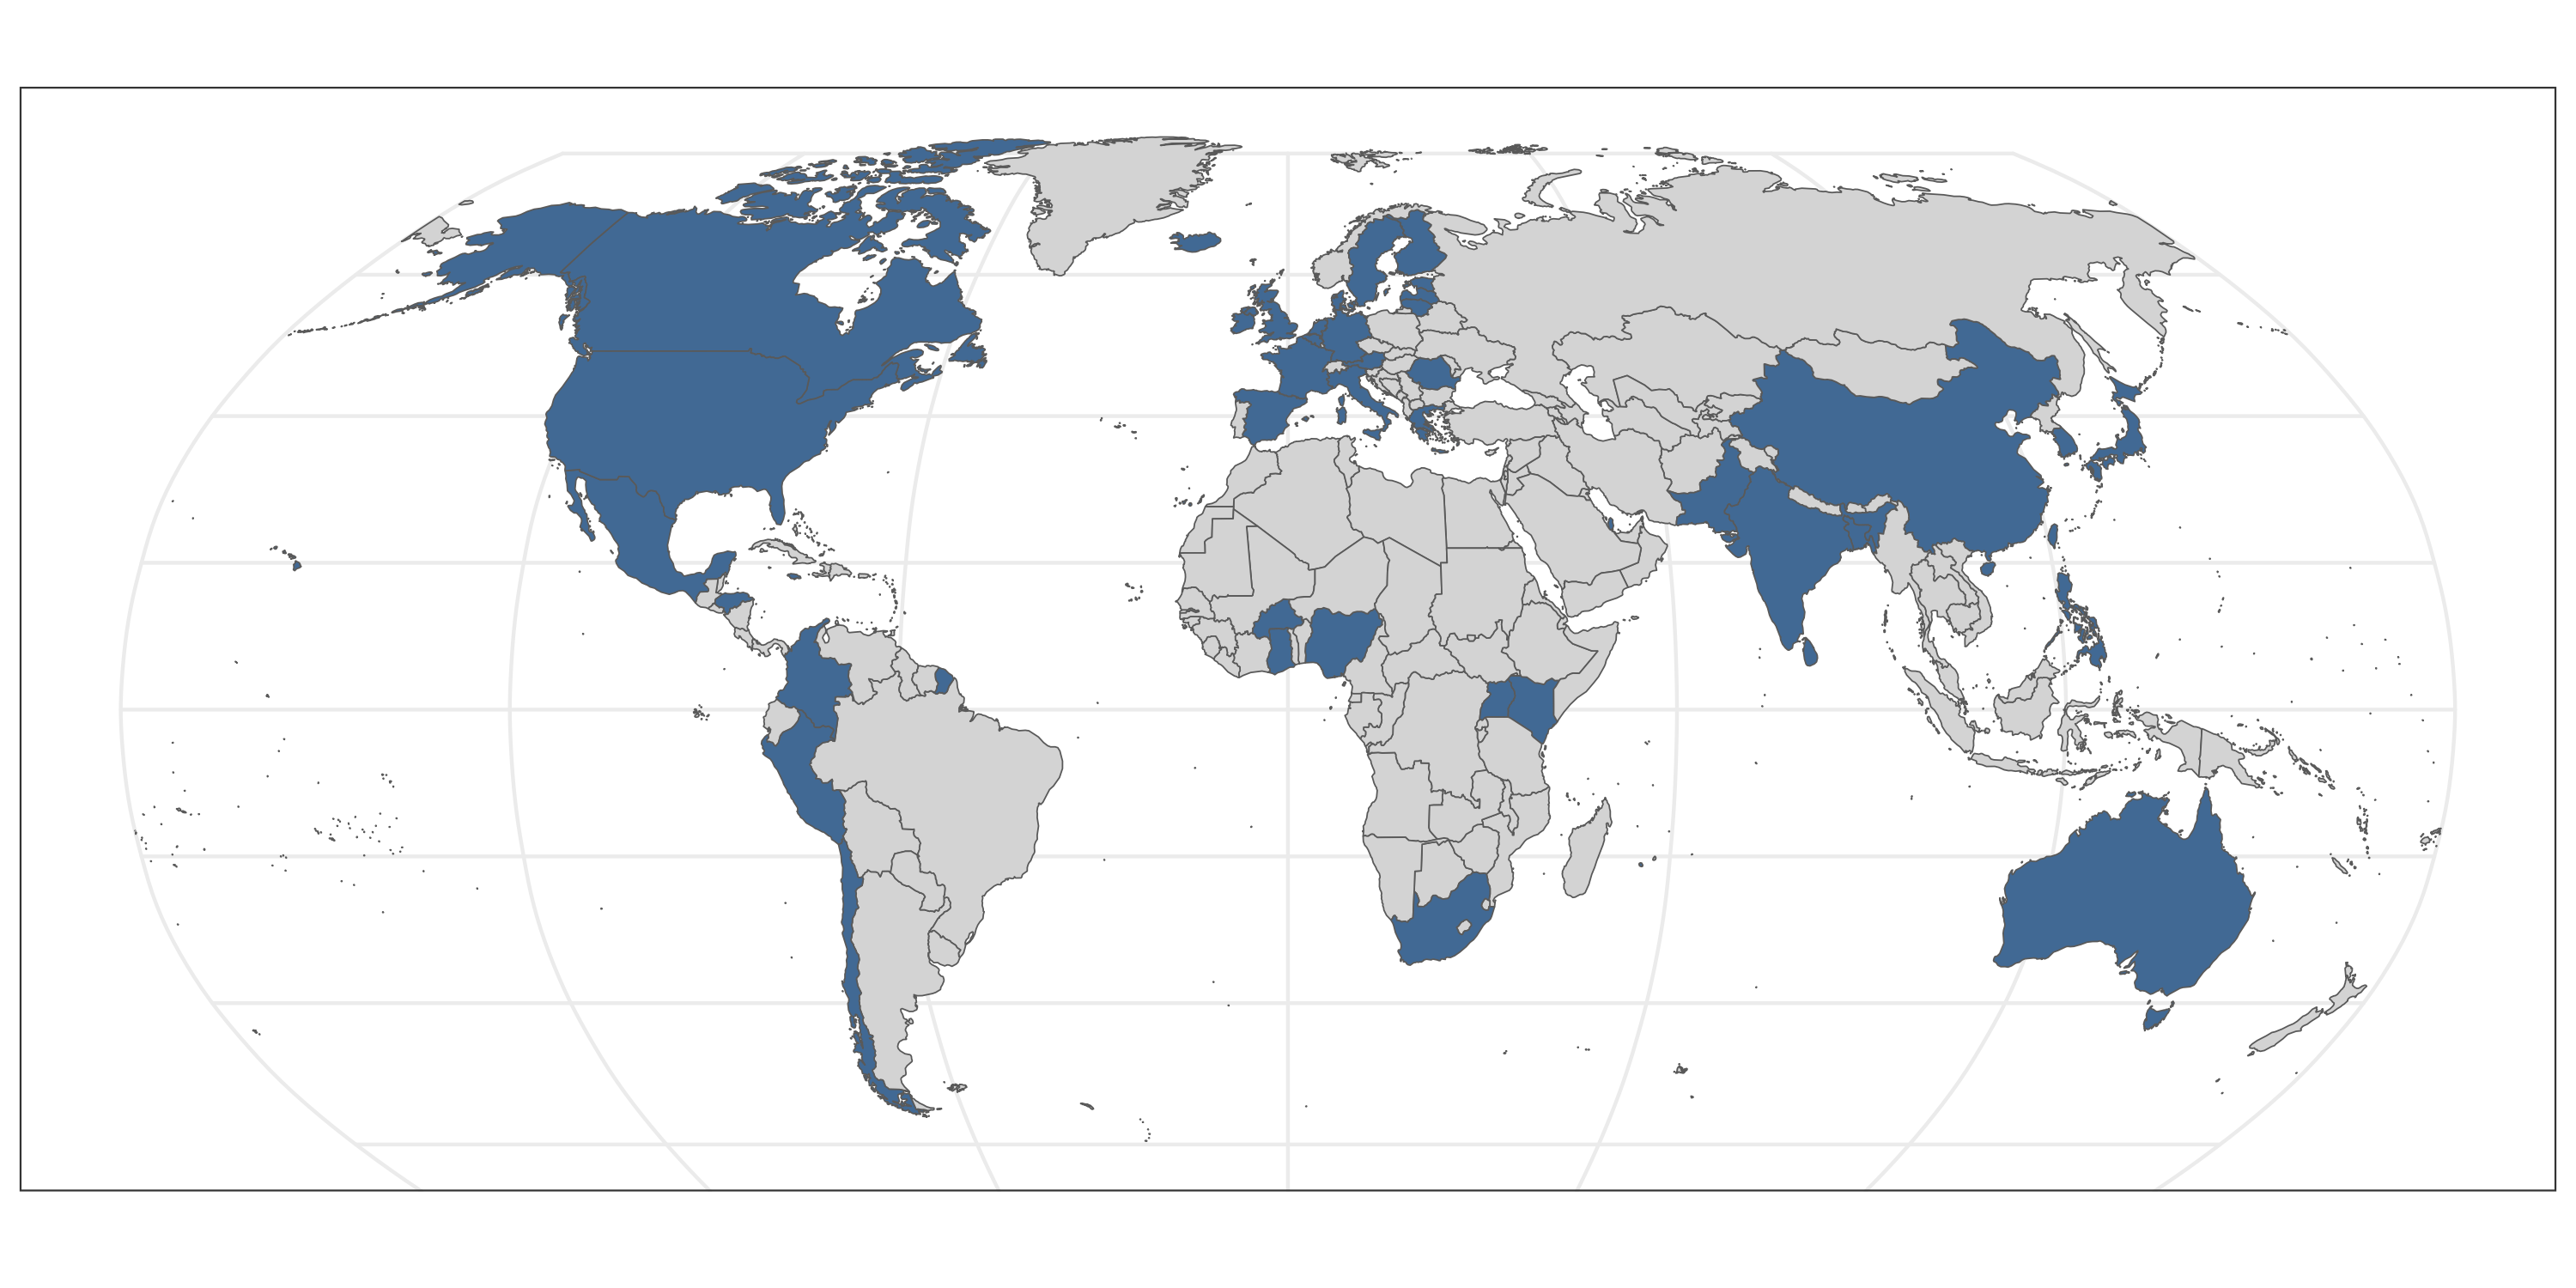
Participant Diversity
Over 40 countries are represented among study participants whose data will be used by the PRIMED Consortium to improve polygenic risk score development and use in diverse genetic ancestry populations.
Back to top
Molecular Data
The PRIMED Consortium utilizes molecular data generated via numerous technologies:
- Exome and Genome Sequencing
- Genotyping Array
- Genome-wide Imputation
- Genomic Summary Results
The Genotype Harmonization Working Group leads the effort to harmonize, standardize, and perform quality control of this data. All individual-level genotype data is available as VCFs in genome build GRCh38.
Back to topPhenotype Data
The PRIMED Consortium analyzes phenotypes across many domains. Current priority phenotype domains and traits are:
| Domain | Phenotypes |
|---|---|
| Anthropometry | Height, Weight, BMI, Waist hip ratio |
| Blood Pressure | Systolic BP, Diastolic BP, Hypertension |
| Cancer | Breast cancer, Prostate cancer |
| Cardiovascular Disease Events | Coronary artery disease (CAD) |
| Diabetes | Type 1 diabetes, Type 2 diabetes |
| Glycemic Traits | Fasting plasma glucose, Fasting serum glucose, Fasting insulin, HbA1c |
| Kidney function | Cystatin C, Serum creatinine |
| Hematology | RBC, Hemoglobin, Hematocrit, MCV, MCH, MCHC, RDW, WBC, MPV, Basophil count, Eosinophil count, Lymphocyte count, Monocyte count, Neutrophil count, Platelet count |
| Lipids | HDL, LDL, Total cholesterol, Triglycerides, non-HDL cholesterol |
The Phenotype Harmonization Working Group leads the effort to inventory, harmonize, standardize, and perform quality control of this data.
Back to topPRIMED Data Model
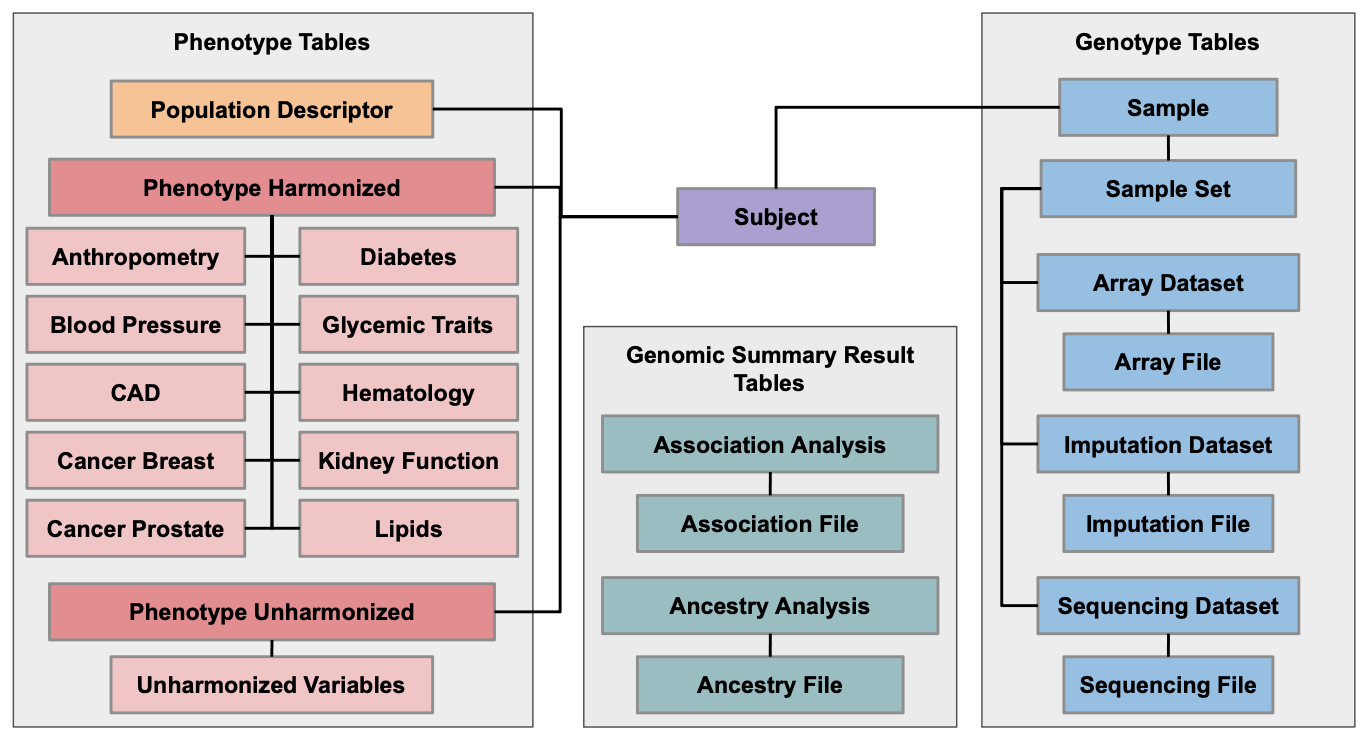
AnVIL relies on data models to define a consistent structure of data and metadata in workspaces, including how data elements are linked across data types. AnVIL data models use the “data tables” feature to organize data, which creates a relational database-like structure that standardizes columns and defines how tables link to each other. This maximizes data findability and usefulness, and it simplifies the process of merging data across workspaces for harmonization and joint analysis.
The PRIMED Genotype Harmonization, Phenotype Harmonization, and Population Descriptors Working Groups developed the PRIMED data model for use in Consortium data workspaces, and all data uploaded to these workspaces are required to conform to this data model. The PRIMED data model is available on GitHub and is depicted in the figure below. If you have questions or are interested in using the PRIMED data model for your own project, please contact the PRIMED Coordinating Center (primedconsortium@uw.edu).
Back to top